Turn every camera into a business decision.
Drasi reads the footfall, dwell and queues your cameras already see — and turns them into staffing, layout and sales decisions that grow revenue per square foot. No new hardware.
Three things your cameras start doing on day one.
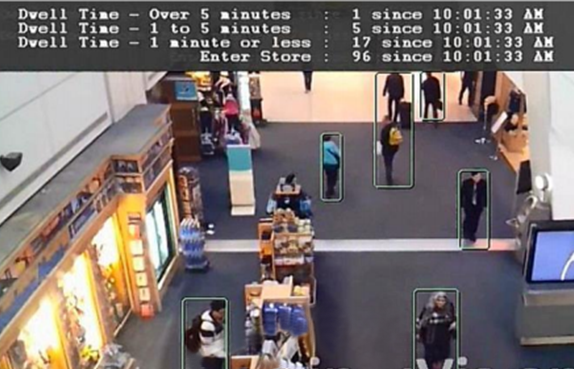
Drasi layers computer vision over the feeds you already record. Every frame becomes a count, a dwell time, a queue length — and every metric maps to a decision a store manager can act on.
Count & convert
Footfall by hour, by door, by store — combined with POS bills to expose true conversion. Staff to actual traffic, not guesswork.
Map & merchandise
Zone-level dwell heatmaps show where attention goes — and where it dies. Place product, plan layout and test displays on evidence.
Queue & retain
Live queue length and wait time trigger counter-opening rules — and quantify the revenue you lose every time someone abandons the line.
One dashboard for every store, every metric.
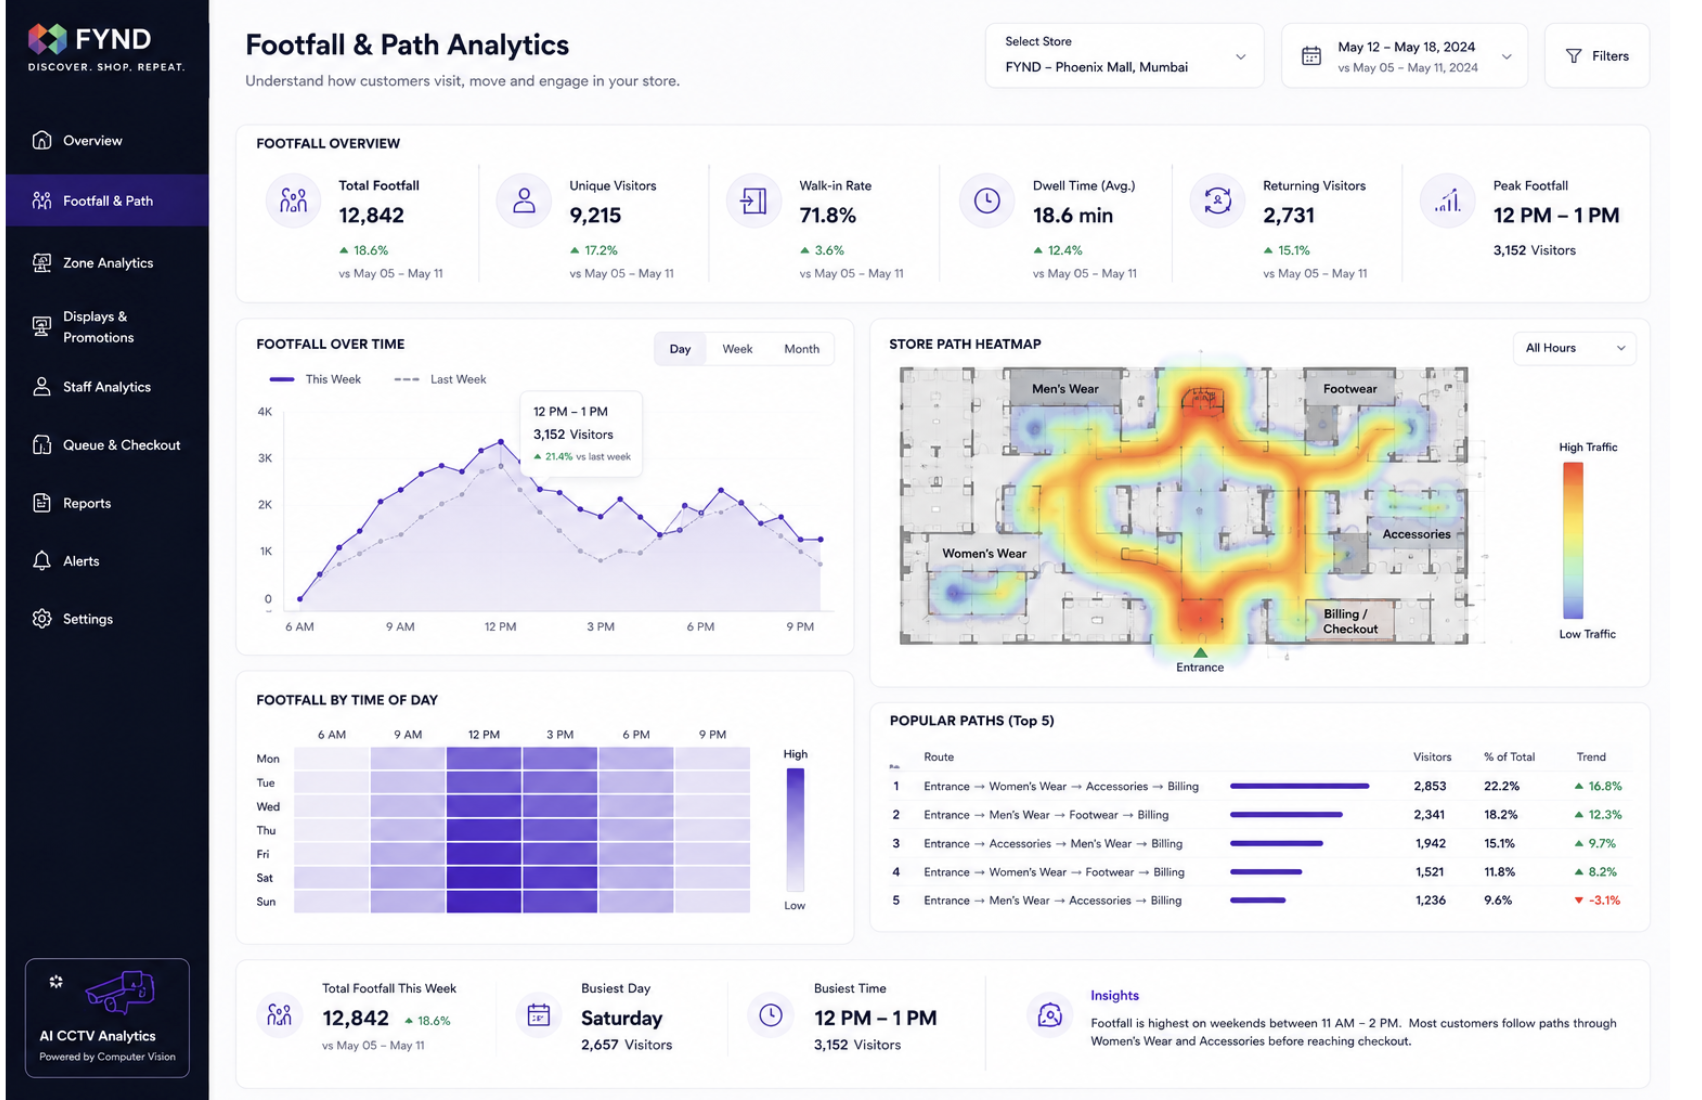
Footfall, dwell and queue analytics across the estate — one screen.
What the platform helps teams decide.
A quick map of the sections below.
Staff to the traffic that actually walks in.
Most rosters are built on gut feel. Drasi maps hour-by-hour footfall against who's on the floor, so you add people where customers are waiting and pull them where the aisles are empty.
"From next month, Store A gets 2 extra salespeople from 4–8 PM on Fri–Sun." Lower manpower cost in quiet hours, better service at peak.
One conversion diagnosis meeting.
Footfall, dwell, staff coverage and POS expose whether a store has a traffic problem or a selling problem.
Evaluate rent, expansion and exit decisions.
Mall A sells $48k on $9.6k rent; High-Street B sells $46k on $6k rent. Efficiency decides the location choice.
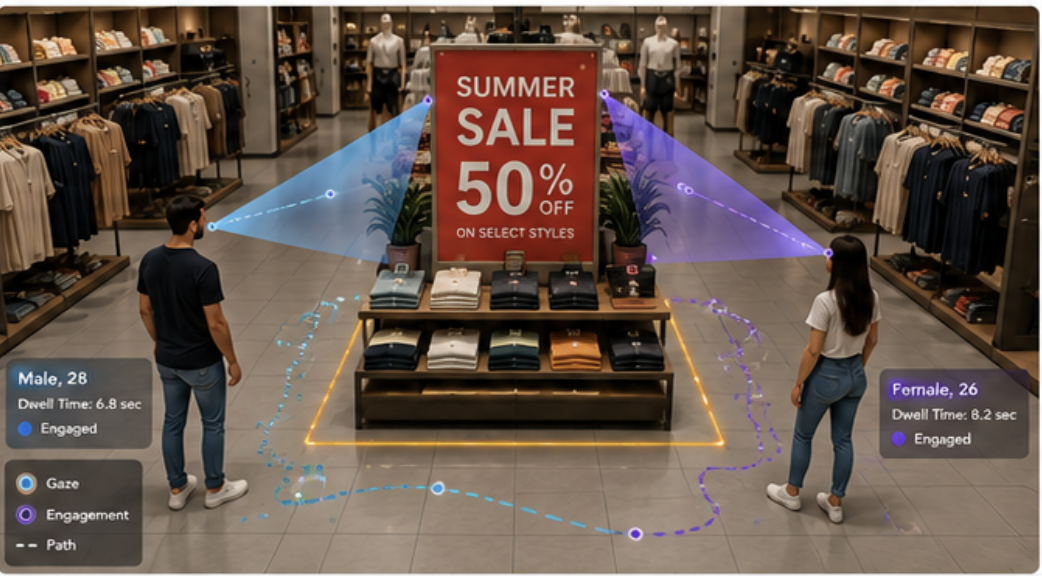
Know which mannequins, signage and offers actually move customers.
Campaign evaluation is a separate analytics layer in Drasi. It measures how shoppers interact with visual merchandising assets before you connect the impact to traffic, conversion and sales.
Keep the window message that increases zone visits. Replace mannequin styling or signage that gets seen but does not create dwell, trials or bills.
 MANNEQUIN + SIGNAGE TRACKING
Separate attention from revenue.
Find the zones that hold attention — and the ones that kill it.
of visitors never leave the first 40% of the store. Only 18% reach the back wall — so bestsellers move deep to pull customers through.
Customers spend the longest in premium denim but barely buy. That's not a traffic problem — it's offer clarity or staffing.
→ Add offer signage, a bundle offer, and a trained associate to the zone.
Heatmaps also rank product placement (sneakers front-left, watches at billing as impulse) and let you A/B test displays store-by-store — merchandising by evidence, not opinion.
Add offer signage, bundle offers and a trained associate before discounting the product.
Move bestsellers or new arrivals deeper and add visibility cues to pull customers through.
Move the category near family/high-footfall routes or add directional signage.
Every abandoned queue is revenue walking out the door.
Drasi watches the till line in real time, opens counters before customers give up, and puts a rupee figure on the walkouts you never used to see.
~20 customers abandon the queue each day at $18 average bill. Drasi turns that invisible leak into a number you can act on.
Why customers leave without buying.
Different exit signatures need different fixes — so you stop blanket-discounting healthy products.
Train the weak stores, reward the right ones.
When two stores see the same traffic and dwell but one converts far worse, the gap is people — not footfall.
Send the regional trainer to Store A. Copy Store B's sales script and staff-allocation model. Auto-alert when a customer dwells >90s in a premium zone with no associate present.
Six lenses. Sixteen plays. One platform.
Every Drasi metric is wired to a documented decision a store team can run this week.
{{ l.desc }}
Start with one store. Scale to the whole estate.
Each rollout path runs on the cameras you already have and focuses on measurable decisions before expansion.
Prove the core traffic-to-sales signal before widening the scope.
Use multiple stores to identify what is repeatable, what is local, and what needs intervention.
Turn analytics into operating rhythms, alerts and training loops for large store networks.
Frequently asked questions
Do we need to buy new cameras?+
How does Drasi measure conversion?+
Is customer privacy protected?+
How fast can one store go live?+
Put Drasi on the shortlist for your next store analytics pilot.
Share your store count and current CCTV setup. The team will review fit, suggest a pilot scope, and follow up with the right next step.